The landscape of Indian media and ad-expenditure is constantly evolving and will continue to witness the fastest growth of 10.7% to reach Rs. 91641 crores. While it is expected to see stable investment across media in India, Digital will garner approx. 65% of incremental ad spends in 2020. Also with the current pandemic situation where the use of print media is on decline, the digital model of marketing is set to gain more popularity.

In the digital age, marketing spend is an important component of total
expenses by any company. Hence the importance on how it's used and how much
actual benefit these campaigns are making can't be understated. These days
marketing is done through multiple channels TV, Radio, Newspaper, Banners,
Social media, etc. which makes it even more challenging to quantify how much
benefit each of these channel is making. Market mix model is a statistical
model accepted industry wide to quantify these benefits and optimize the budget
allotment to different campaigns.
Table of Content
1.
Introduction
2.
What you'll learn
3.
What is MMM?
4.
A walkthrough in Python
5. How to use the model
Introduction
The things discussed here are related to a common real life problem that many businesses face - the science of determining how much each marketing channel is contributing to the sales/conversions. Introduction of offline channels such as TV, radio pose some particular difficulty as there's no direct way of measuring their impact. MMM defines the effectiveness of each of the marketing elements in terms of its contribution to sales-volume, effectiveness (volume generated by each unit of effort), efficiency (sales volume generated divided by cost) and ROI. These learnings are then adopted to adjust marketing tactics and strategies, optimize the marketing plan and also to forecast sales while simulating various scenarios.
What You’ll Learn?
- What is Marketing Mix Modeling (MMM) and how to assess various marketing channels
- Fundamental concepts and techniques to explore your data
- Implementation of OLS model and how to assess it
What is a Marketing Mix Model?
A Marketing Mix Model (MMM) is a technique used to determine market attribution. Specifically, it is a statistical technique (usually regression) on marketing and sales data to estimate the impact of various marketing channels.
Unlike Attribution Modeling, another technique used
for marketing attribution, Marketing Mix Models attempt to measure the impact
of immeasurable marketing channels, like TV, radio, and newspapers. Generally,
your output variable will be sales or conversions, but can also be things like
website traffic. Your input variables typically consist of marketing spend by
channel by period (day, week, month, quarter, etc…), but can also include other
variables.
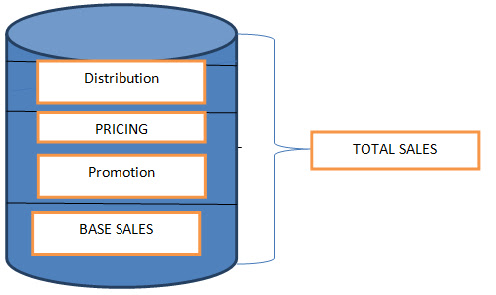
On breaking the phrase, we get three words i.e. Marketing, Mix and Modeling.
Let's explore these terms.
- Marketing: This term corresponds to the understanding the market.
- Mix: Mix here refers to how much importance should each P be given in the 4P’s (Product, Price, Place and Promotion)
- Modeling: Modelling here refers to the optimization and building the model.
How is the impact/contribution measured?
This is accomplished by
setting up a model with the sales volume/value as the dependent variable and
independent variables created out of the various marketing efforts. Then
statistical methods such as OLS, multivariate time series, GLM are used to
estimate the ROI of a marketing strategy.
And the answer to why regression which probably you are thinking is very simple. Each brand has a different market and cost structure, different characteristic. It depends on the various strategies of promotion and advertisement. Hence it can be very useful to separate and decompose the effect of different marketing efforts. The impact of a strategy in terms of output (i.e. Sales) vs Investment (i.e. per extra money spend) can be quite useful and regression output gives us, Y as a function of change in other dependent variables which here is our marketing spend composition.
The model can further be validated with forecasting on kept out data or using the business results.
Data Modeling
First we build a univariate model for Total sales vs Price per Unit relationship.

The Adj. R-squared is 0.689,
hence the model is explaining ~69% of variation in the data. With every unit
change in Price there is increase of 520 units in sales.
Now let's add more variables
to our next regression model and see what happens. Here I have included only
few variables which might seem more interesting than others and also pertain to
my business problem.

Limitations
While marketing mix models provide much useful information, there are areas in which these models have limitations that should be taken into account.
- This one is easy and very important, the impact of each per unit is not same and has diminishing returns in contrast to the linear relationships which are non-linear in real world.
- The focus on short-term sales can significantly under-value the importance of longer-term equity building activities such as brand value.
Thank you for patient reading...
Comments
Post a Comment